| Section | Problems to do | Target date | Quiz | Comments |
|---|---|---|---|---|
| 1.1 | #1.3, 1.5, 1.7 | Thursday, January 24 | 1 | |
| 1.1 | #1.13, 1.15, 1.17, 1.18, 1.19, 1.20, 1.21, 122, 1.23 | Friday, January 25 | 1 | For Problem 1.23, you can get to the applet at the textbook website. |
| 1.2 | #1.41, 1.43, 1.45, 1.47, 1.49, 1.58, 1.59, 1.71, 1.77 | Monday, January 28 | 1 | For 1.43, you can use the One Variable Statistical Calculator applet at the textbook website. |
| 1.1 | #1.37, 1.38, 1.39 | Tuesday, January 29 | 1 | See daily note for Monday, January 28. |
| 1.3 | #1.78, 1.79, 1.80, 1.81 | Thursday, January 31 | 2 | |
| 1.3 | #1.83, 1.84, 1.87, 1.96, 1.97 | Friday, February 1 | 2 | |
| 1.3 | #1.93, 1.99, 1.102 or 1.103, 1.104 or 1.105, 1.115 | Monday, February 4 | 2 | Where you have a choice, choose the problem that concerns the test you took (ACT or SAT). Note that information on the distributions of scores for the tests is given in the paragraph that starts at the bottom of page 87. |
| 1.3 | #1.119, 1.120, 1.121, 1.124 | Tuesday, February 5 | 2 | |
| 2.1 | #2.1, 2.3, 2.7, 2.9, 2.13 | Thursday, February 7 | - | For 2.13, see note below on Minitab. |
| 2.2 | #2.21, 2.23, 2.31 | Thursday, February 7 | - | |
| 2.2 | #2.26, 2.32, 2.34, 2.38, 2.39 | Friday, February 8 | - | |
| 2.3 | #2.43, 2.45, 2.47, 2.53, 2.54 | Tuesday, February 12 | - | |
| 2.4 | #2.63, 2.65, 2.69, 2.71, 2.79, 2.81 | Tuesday, February 12 | - | |
| 2.5 | #2.85, 2.88, 2.91, 2.93 | Monday, February 18 | 3 | |
| 3.1 | #3.3, 3.5, 3.6, 3.7 | Monday, February 18 | 3 | |
| 3.2 | #3.12, 3.13, 3.15, 3.19, 3.23, 3.29, 3.31 | Tuesday, February 19 | 3 | |
| 3.3 | #3.37, 3.41, 3.47, 3.48, 3.53, 3.55, 3.56, 3.57 | Thursday, February 21 | 4 | |
| 3.4 | #3.62, 3.66, 3.67, 3.69, 3.75 | Friday, February 22 | 4 | For 3.75, you will do by hand what we saw going on in the applet during class. It's a bit tedious to do this by hand, but essential in order for you to understand what's going on. |
| 4.1 | #4.1, 4.4, 4.7 | Monday, February 25 | 4 | For 4.7, you can use real dice if you have them around. |
| 4.2 | #4.11, 4.13, 4.14, 4.15, 4.21, 4.23, 4.25, 4.27, 4.30, 4.31 | Tuesday, February 26 | 4 | |
| 4.3 | #4.41, 4.43, 4.45, 4.49 | Friday, February 29 | - | |
| 4.3 | #4.48, 4.53, 4.55, 4.56, 4.57 | Monday, March 3 | - | We did parts (a), (b), and (c) of Problem 4.48 in class this week as an example. |
| 4.4 | #4.59, 4.61, 4.63, 4.65, 4.67, 4.71, 4.81 | Monday, March 3 | - | |
| 4.4 | #4.69, 4.70, 4.74, 4.79 | Tuesday, March 4 | - | |
| 5.1 | #5.1, 5.3, 5.5, 5.13 | Monday, March 10 | 5 | |
| 5.1 | #5.11, 5.19 | Tuesday, March 11 | 5 | |
| 5.1 | #5.14, 5.17, 5.20, 5.23 | Friday, March 14 | 5 | |
| 5.2 | #5.28, 5.33, 5.37, 5.39, 5.41, 5.43 | Thursday, March 27 | - | |
| 6.1 | #6.1, 6.5, 6.7, 6.13, 6.15, 6.16, 6.19 | Thursday, March 27 | - | Regarding Problem 6.13: 80 minutes per week? How about 80 minutes per day! |
| 6.2 | #6.35, 6.39, 6.41, 6.43, 6.51, 6.54, 6.55, 6.57 | Monday, March 31 | - | |
| 6.3 | #6.73, 6.74, 6.77, 6.82, 6.83 | Tuesday, April 1 | - | |
| 7.1 | #7.18, 7.21, 7.26, 7.34, 7.35 | Tuesday, April 8 | 6 | |
| 7.1 | #7.1, 7.10, 7.11, 7.24, 7.29, 7.31 | Thursday, April 10 | 6 | |
| 7.2 | #7.53, 7.57, 7.77, 7.81, 7.83 | Monday, April 14 | 6 | |
| 8.1 | #8.3, 8.5, 8.7, 8.11, 8.13 | Thursday, April 17 | - | |
| 8.1 | #8.9, 8.19 | Friday, April 18 | - | |
| 8.1 | #8.26, 8.27 | Monday, April 21 | - | |
| 8.2 | #8.31, 8.33, 8.37, 8.47, 8.48, 8.51, 8.52, 8.53 | Monday, April 21 | - | |
| 9 | #9.1, 9.9, 9.19, 9.27, 9.33, 9.38, 9.39 | Tuesday, April 29 | 7 | For Problem 9.1, you'll need to read about the language of joint and marginal distributions in Section 9.1. |
Your course project report is due by Wednesday, May 14 at 2 pm. You can bring it to my office anytime before then. If I am not in, just slide it under my door.
I will be available for help during Reading Period and exam week except for Monday, May 12 when I will be out of town. E-mail or call if you want to set up a specific time to meet. Otherwise, drop by my office to see if I'm around.
We will not have class on Monday. I'll be available during regular class time for an office hour.
On Tuesday, I'll return your exams and address any questions on the course project. We'll then have Quiz #7. Since many of these problems involve lots of numbers, you can bring your results (done by hand or in Minitab) to attach to the quiz.
The course project final report is due by 2 pm on Wednesday, May 14. I'll be available for questions during reading period and on Tuesday and Wednesday of final exam week but not on Monday, May 12 of exam week.
Here's the handout on the course project final report.
I have not assigned additional problems today.
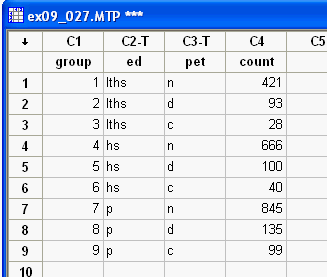
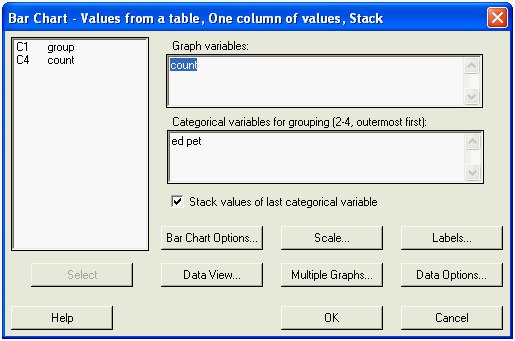
Here's some directions on getting a "stacked" bar chart in Minitab. As example, let's use the data from Problem 9.27 that we looked at in class. Here's what the textbook's data file for this problem looks like in Minitab:
In Minitab, go to the Graph: Bar Chart.... In the dialog box, select Values from a table in the menu under Bars represent:. If your data file has all of the counts in one column, choose Stack from One column of values. Hit OK to bring up a dialog box. Set up the graph variable and categorical variables as shown here:
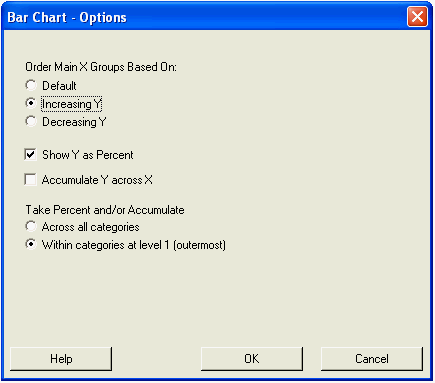
Now hit the Bar Chart Options... button. This brings up another dialog box. To get a bar chart similar to the one we started making in class, set up the following options:
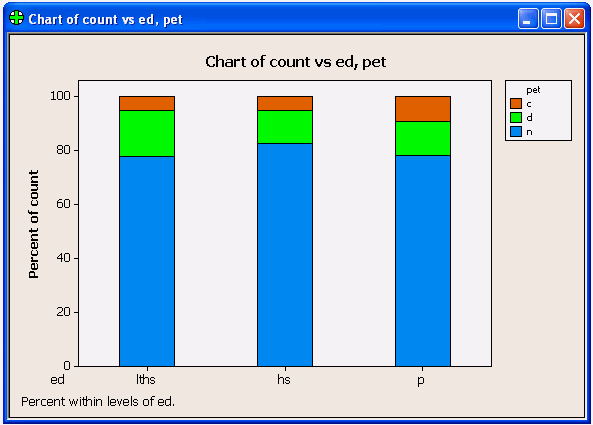
After hitting OK for this dialog box and then OK again for the main dialog box, Minitab gives us the following bar chart:
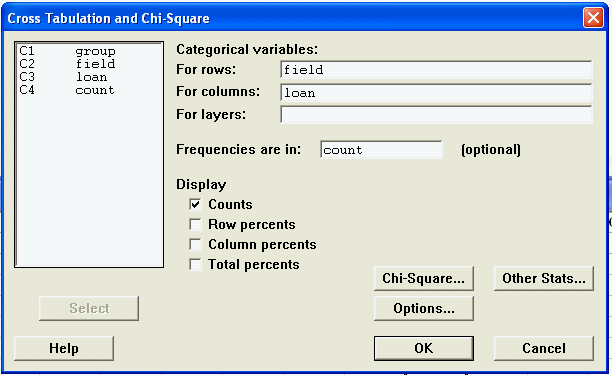
If you use the Minitab data files that are supplied with the text for the Chapter 9 problems, you'll want to use Stat: Tables: Cross-Tabulation and Chi-Square.... In the dialog box that opens, you'll need to identify the appropriate worksheet columns for
As an example, here's what the set-up should look like for Problem 9.38:
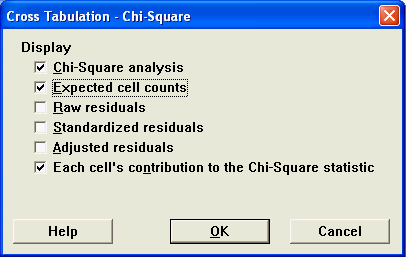
You'll also want to select a few options available using the Chi-Square... button. Here's a picture of the options you'll probably want:
I have not assigned new problems. For now, you can focus on your descriptive statistics report for your course project (due Monday) and your news report critique (due Friday).
Exam #4 will be on Thursday from 11:00 am to 12:20 pm. (Note that this 80 minute period will last longer than our usual class session.) The exam will cover material from Sections 7.1, 7.2, 8.1 and 8.2. The handout Exam 4 Objectives has a list of specific objectives for the exam.
For the exam, you can bring
Here's my standard advice on how to prepare for an exam:
I will be available this afternoon (Tuesday) for office hour from 1:30 to 2:30 and for appointments from 2:30 to 3:30. After that, I'll be busy with appointments and meetings. On Wednesday, I'm available for appointments part of the morning and after 2:30 in the afternoon. E-mail or call if you want to set up a time to meet.
Yesterday in class, we had a brief discussion about the "dual" nature of significance tests and confidence intervals. There are some specific details on this in the text on page 414.
In class today, we compared use of pooled and nonpooled statistics for comparing two proportions.
Exam #4 will be on Thursday from 11:00 am to 12:20 pm. (Note that this 80 minute period will last longer than our usual class session.) The exam will cover material from Sections 7.1, 7.2, 8.1 and 8.2. I will post a handout with specific objectives tomorrow.
For the exam, you can bring
Here's my standard advice on how to prepare for an exam:
I've assigned two additional problems from Section 8.1 that deal with choosing a sample size to get a required margin of error. I've also assigned problems from Section 8.2 on inference for comparing two proportions.
The answer in the back of the text for Problem 8.7 (a) is incorrect. The value given there is the standard error, not the margin of error. To get the margin of error, you must multiply by the appropriate critical z value.
Our next (and last!) exam will be on Thursday, April 24 from 11:00 am to 12:20 pm.
In class, we looked at inference for a population proportion. The methods (confidence interval and significance test) we used assume a large sample so that the underlying distribution is approximately a normal distribution. The text refers to these methods as the large sample methods. Our use of these methods wasn't approriate for our first example with a sample size of 55 and a count of only 7 "successes". The results we got using Minitab are based on exact methods that go back to using the exact binomial distribution for counts.
At the end of class, we briefly looked at the pooled two-sample t-procedures. We won't use these in this class but you may encounter references to pooled estimates in the literature you read for other classes and projects.
I did not assign additional problems today.
In class, I distributed a handout on the fourth assignment for the course project.
I have not assigned additional problems since we just started talking about the next set of ideas. I'll assign problems from Section 7.2 after class tomorrow.
I have assigned additional problems from Section 7.1.
You can use Minitab to compute confidence intervals or P-values. Go to Stat: Basic Statistics: 1-Sample t.... In the dialog box that comes up, you have a choice between Samples in columns or Summarized data. Use Samples in columns if you have data in a worksheet. Use Summarized data if you already know the sample mean and sample deviation. If you leave Test mean empty, Minitab will return a confidence interval but not a P-value. You can go to Options... to select the confidence level or select the type of alternative hypothesis.
We will not have a quiz this Thursday.
If you have a TI-83/84 calculator, you can get cumulative probabilities for t-distributions. Go to the DISTR menu and select tcdf(. The required arguments for tcdf are a lower bound, an upper bound, and the degrees of freedom. For the example we did in class, we needed the cumulative probabilty between t=-1.4 and t=1.4 for df=4. The input tcdf(-1.4,1.4,4) returns a value of 0.766. The P-value for our example is thus 1-0.766=0.234. Note that this is consistent with our estimate in class (based on Table D) that the p-value is between 0.20 and 0.30.
We will not have a quiz this week since we haven't had new homework assignments recently. The next quiz will be Quiz #6 on Thursday, April 17.
The third step in your course project is to do a pilot study. Details are in this handout. A brief report on your pilot study is due Monday, April 7.
I have not assigned additional homework problems.
Exam #3 will be on Thursday from 11:00 am to 12:20 pm. (Note that this 80 minute period will last longer than our usual class session.) The exam will cover material from Sections 5.1, 5.2, 6.1, 6.2, and 6.3. The handout Exam 3 Objectives has a list of specific objectives for the exam.
For the exam, you can bring
Here's my standard advice on how to prepare for an exam:
For today (Tuesday), I will be available most of the afternoon until about 5:30. For Wednesday, I will be available 9:00-12:00, 2:30-4:00, and 5:00-5:30 with the exception of a few appointments I already have scheduled.
Exam #3 will be on Thursday, April 3 from 11:00 am to 12:20 pm. (Note that this 80 minute period will last longer than our usual class session.) The exam will cover material from Chapters 5 and 6.
I've assigned a few problems from Section 6.3
I've assigned problems from Section 6.2 on significance tests.
Exam #3 will be on Thursday, April 3 from 11:00 am to 12:20 pm. (Note that this 80 minute period will last longer than our usual class session.) The exam will cover material from Chapters 5 and 6.
The third step in your course project is to do a pilot study. Details are in this handout. A brief report on your pilot study is due Monday, April 7.
In class today, we started an example of a significance test but did not finish so I have not yet assigned problems from Section 6.2. I'll do this after tomorrow's class. For now, focus on making sure you can do and understand the assigned problems from Sections 5.2 and 6.1.
If you have not yet turned in or talked with me about your study design proposal, get in touch with me as soon as possible.
Exam #3 will be on Thursday, April 3 from 11:00 am to 12:20 pm. (Note that this 80 minute period will last longer than our usual class session.) The exam will cover material from Chapters 5 and 6.
Yesterday, I neglected to upload the updated web page to the web server so the assignment for Section 5.2 did not get posted. It's there now along with an assignment for Section 6.1.
Today, we had our first look at confidence intervals. The text's description of a confidence interval is worth repeating:
A level C confidence interval for a parameter is an interval computed from sample data by a method that has probability C of producing an interval containing the true value of the parameter.The confidence intervals we compute will have the form estimate � margin of error. The estimate will be a particular value of a statistic. The margin of error m will depend on the confidence level C that is chosen and on the distribution of values for the statistic.
In each of the examples we did in class, we computed a confidence interval for a population mean. Later, we will learn how to compute confidence intervals for other parameters such as a population proportion.
In class, we went over a handout with questions to refresh our memories about things we did before break. Here's a version with some responses.
In class, we looked at several of the problems from the most recent
assignment for Section 5.1. These problems have the following
structure:
If the population proportion p is given, find the probability that a SRS of given size n has a sample proportion p̂ in a given interval.We will soon be turning this around and deal with problems having the structure:
If a SRS of given size n has a sample proportion p̂, find an interval containing p̂ so that the population proportion p has a given probability of being in that interval.
I have not assigned any additional problems. After break, we will begin looking at sampling distributions for sample means (rather than sample proportions which we've been studying this week).
Enjoy your break!
In class, I displayed a handout comparing theory and data for counts in a simple random sample. I'm including this link for you reference.
I have not assigned additional problems from Section 5.1. I'll do this after Thursday's class once we have talked about the normal approximation for a binomial distribution.
Quiz #5 on Thursday will cover the problems assigned from Section 5.1 so far.
In class, I distributed a handout on the second step in the course project.
We have looked at three ways to get probabilities for a binomial distribution B(n,p):
Note that Table C has mistakes for n=5,6,7 in the First and Second Printings of the text.
To get binomial distribution probabilities in Minitab, go to Calc: Probability Distributions: Binomial.... In the dialog box, you can select Probability or Cumulative Probability depending on what you need. Then, enter a value for Number of trials (this is what we usually label n) and a value for Probability of success (this is what we usually lablel p). At the bottom of the dialog box, choose Input constant and then enter a value (this is what we usually label k). After you hit OK, Minitab will return information the Session window. To get probabilities for more than one value, set up a column of values in a Worksheet window. Then, go to Calc: Probability Distributions: Binomial... Do as above except choose Input column at the bottom and then specify the column you set up.
To get binomial distribution probabilities on a TI 83/84, go to the DIST menu and scroll down to binomialpdf. The correct syntax is binomialpdf(n,p,k). This will return the probability of a count k in the binomial distribution B(n,p). The TI-83/84 also has a cumulative probability function called binomialcdf.
Today, we developed the binomial model for the distribution of counts of success in the binomial setting. Each value of sample size n and proportion p of successes leads to a different binomial distribution. We computed the binomial distribution probabilities for a few specific values of n and p. From now on, we will use tables or technology to get binomial distribution probabilities. Table C in our text has binomial distribution probabilites for n ranging from 2 to 15 and also for n=20. For each value of n, various choices of p are given. At the end of class, we computed the probabilities for B(5,0.2). You should find the corresponding part of Table C and check that the values there match what we got in class.
On Monday, I will show you how to get binomial distribution probabilities using Minitab or a TI-83/84.
I meant to say a few words in class about the law of large numbers. Yesterday, we used this idea implicitly in talking about the implications of results for Problems 4.65 and 4.81. In each of these situations, we had positive returns (gains) and negative returns (losses) possible. The mean return was positive in each case. This mean is related to a theoretical or idealized situation of infinitely many repetitions of the random process. What can we say about the result of a finite number of repetitions? The law of large numbers is a guarantee that the average for a finite number of repetitions will get close (and stay close) to the idealized mean as the number of repetitions increases. So, in these cases, the law of large numbers guarantees that the business model will be successful in the long run. (Note that the short run can be a problem since large fluctuations in the average return are possible . Investors, insurance companies, and casinos need to start with a large reserve in order to avoid going broke in the short run.)
Exam #2 will be on Thursday, March 6 from 11:00 am to 12:20 pm. (Note that this 80 minute period will last longer than our usual class session.) The exam will cover material from Chapters 3 and 4 through Section 4.4. (The optional Section 4.5 will not be included.) I will put together a list of specific objectives and post a link here later this evening or early tomorrow morning. The handout Exam 2 Objectives has a list of specific objectives for the exam.
For the exam, you can bring
Here's my standard advice on how to prepare for an exam:
I will be available today (Tuesday) for most of the afternoon up until 5:00 pm. On Wednesday, I will be available most of the day except noon to 2 pm.
If you are looking for additional problems on which to practice, you can check out the Old exams and the end-of-chapter exercises for Chapters 3 and 4 in the text.
In class, I distributed a handout with some problems. You should do these as part of your homework, along with the new problems from Section 4.4 assigned above. Note that this handout is similar to the one posted in Friday's note but has one additional problem.
Exam #2 will be on Thursday, March 6 from 11:00 am-12:20 pm. The exam will cover material from Chapters 3 and 4 of the text.
At the end of class, we did one example of getting the mean, variance, and standard deviation of a random variable that is a sum of two other random variables. This handout has two similar problems you should try as part of your homework for this weekend.
At the beginning of class, we talked about how to count outcomes on a pair of dice. Some people are uncomfortable with the fact that we distinguish between "one on first, two on second" and "two on first, one on second" so that the combination of "a one and a two" gets counted twice while the combination of "a one and a one" gets counted only once. This can seem even less comfortable if we are looking at values of a random variable such as "X= sum of the two dice values". The dice outcomes "one on first, two on second" and "two on first, one on second" both give the value of 3 for the random variable X. There are two legitimate ways to approach the question of counting outcomes:
Your project proposal is due on Monday. Here's some sources of ideas for project topics:
We will have Exam #2 next week on Thursday, March 6 from 11:00 am-12:20 pm. The exam will cover material from Chapters 3 and 4 of the text.
At the end of class, you started working out the probability distribution for the difference of the values on a pair of rolled dice. Here's a handout on what I'd like you to do as homework in finishing this up.
In class, we focussed on discrete random variables. In the text, the ideas we looked at are covered in Sections 4.3 and 4.4 These sections also discuss continuous random variables. We'll discuss continuous random variables in class tomorrow.
I've assigned a few problems from Section 4.3.
In class, I displayed a handout on the Shared Birthday problem. I'm including this link for your reference.
I have not assigned new problems since we have not discussed material beyond Section 4.2. We will start class on Thursday with a quiz covering homework assignments as listed above.
I'll be available much of the afternoon today (Tuesday) and most of Wednesday with the exception of noon to 2 pm. If you have questions, stop by or contact me to arrange a specific time to meet.
In class, I distributed the News Report Critique assignment and the first assignment for the course project.
For the next few weeks, we'll be looking at topics that are more mathematical in nature, namely probability and sampling distributions. Concepts from these areas will inform us about the reasoning in statistical inference, which is the heart of this course.
I've assigned a few problems from Section 4.1.
Section 3.4 is the last of the largely descriptive sections in the text for now. It is well worth reading this section carefully because it sets the stage for much of what we will do in the remainder of the course.
Quiz #3 will be at the beginning of class on Thursday. It will cover problems from assignments as indicated above.
In class, we looked at The New York Times Polls page for an example of details on how a survey sample was selected and the care needed in writing survey questions. You might need to set up an account in order to view some full pages at the NY Times site.
Using a table of random digits to make random assignments may seem archaic. However, you should get some practice in doing this so you can understand references to this procedure that you may encounter in older technical articles.
You can use Minitab to make random assignments of subjects to treatment groups. Here's one method: Make a column containing an identifier (name or number) for each subject. Go to Calc: Random Data: Sample from Columns.... Enter the number of rows to sample (the total number of rows you have), the column to sample, and a column to store the results. This function will fill the new column with the identifiers in a random order. If you experiment design calls for n subjects in each group, you can put the first n from the randomized list in the first treatment, the second n in the second treatment, and so on. In our example from class, we had a total of 52 subjects for three treatments. This is n=17 subjects for each treatment (with one left over). So, we could build a randomized list of the 52 subject names (or numbers) in Minitab and then put the first 17 from the list in Treatment 1, the next 17 from the list in Treatment 2, and the remaining 18 from the list in Treatment 3.
I've assigned problems from Section 3.2.
If you want more details on the study we read about in class today, the
article is available online through the UPS Library:
"A controlled trial of arthroscopic surgery for osteoarthritis of the
knee"
J Bruce Moseley, Kimberly O'Malley, Nancy J Petersen, Terri J Menke, et
al.
The New England Journal of Medicine.
Boston: Jul 11, 2002. Vol. 347, Iss. 2; pg. 81.
To access this link, you will need to be using a computer on the UPS
campus network. If you are off-campus, you might be able to access the
link after entering your UPS login name and password in a dialog box (for
something called a "proxy server").
I've assigned problems from Sections 2.5 and 3.1.
The handout Residual Example has details from the hand span-height example we looked at in class.
Exam #1 will be on Thursday, February 14 from 11:00 am to 12:20 pm. (Note that this 80 minute period will last longer than our usual class session.) The exam will cover material from Chapters 1 and 2 through Section 2.4. The handout Exam 1 Objectives has a list of specific objectives for the exam.
For the exam, you can bring
Here's my standard advice on how to prepare for an exam:
I will be available today (Tuesday) for most of the afternoon up until 5:00 pm. On Wednesday, I will be available most of the day except noon to 2 pm. I will also have an evening office hour on Wednesday from 7 to 8 pm in our classroom (TH 381).
If you are looking for additional problems on which to practice, you can check out the Old exams and the end-of-chapter exercises for Chapters 1 and 2 in the text.
Exam #1 will be on Thursday, February 14 from 11:00 am to 12:20 pm. (Note that this 80 minute period will last longer than our usual class session.) The exam will cover material from Chapters 1 and 2 through Section 2.4. We'll spend some class time tomorrow talking about what to expect on the exam.
I've assigned problems from Sections 2.3 and 2.4 so you can see what to do between now and the exam on Thursday. For tomorrow, focus on the problems from Section 2.3.
In class, we looked at an example of data from a physics experiment to illustrate the point that correlation is not meaningful unless there is evidence of a linear association between two variables. For reference, here is a handout with that example. The handout has a second example that comes from a problem in the text.
I will have an evening office hour on Wednesday. I'll tentatively plan this for 7 to 8 pm but can go a bit earlier or later if enough people are interested.
As attendance was very sparse, let's consider today's class as cancelled. To accommodate the (reasonable) choice that most made to attend one of the campaign events in the area, I'll put off discussing regression lines until Monday. On Tuesday, we'll finish up on some ideas from Section 2.4. We'll have our first exam on Thursday. This will cover material from Chapters 1 and 2 except Section 2.5. We will not have a lot of class time on Monday and Tuesday to discuss questions from homework problems so I will leave it to you to come ask questions outside of class.
The handout Correlation example we looked at in class today had a typo. The final value for the correlation should be 0.746 rather than 0.781. Note that the value of 0.746 matches what we got using Minitab. The version of the handout linked to above is corrected.
To get a correlation using Minitab, go to Stat: Basic Statistics: Correlation.... In the dialog box, you can enter two or more choices under Variables:. You might also want to uncheck the Display p-values option since we don't yet know what these mean. If you enter more than two variables, you'll get a table showing the correlation for each pair of variables.
I've added more problems from Section 2.2.
Quiz #2 will be at the beginning of class on Thursday
I've assigned a few problems from Sections 2.1 and 2.2. I'll assign a few more for Section 2.2 after the next class session. For Exercise 2.13, you are asked to make a scatterplot that distinguishes points for male and female individuals. To do this in Minitab, you'll need a data file with a column for sex in addition to the columns for mass and rate. In Minitab, go to Graph: Scatterplot.... In the first dialog box, change to With Groups from the default of Simple. In the following dialog box, set up Y variables and X variables as usual. Then, enter sex in the box labeled Categorical variables for grouping (0-3):.
Our first exam is scheduled for Thursday, February 14. It will cover material from Chapters 1 and 2.
A Probability Plot in Minitab serves the same purpose as a normal quantile plot as described in the text. The default format for probability plots in Minitab differs from what the text uses in three ways:
You can use the Minitab default. The central question remains the same: To what degree do the points fall along a straight line? The more the points fall along the line, the more closer the distribution is to being normal. With the Minitab default, granularity will show up as points lined up vertically. With the text's choices, granularity will show up as points lined up horizontally. You don't need to worry about the precise meaning of the 95% confidence interval curves. You can use these in making a judgment about normality. If most of the points fall within the curves, assuming normality is probably fine.
Here's steps you can take to have Minitab produce a plot in the same style as the text:
If you want to get rid of the confidence interval curves, go to Distribution... on the main dialog box (next to the Scale... button you used above). Go to the Data Display tab and uncheck Show confidence intervals.
To get proportions for normal distributions in Minitab, go to Calc: Probability Distributions: Normal.... Make sure the option Cumulative probability is selected. You'll need to enter a mean and a standard deviation. You can then select the option Input constant: and fill in the relevant value.
On a TI-83 or TI-84, you can go to the DISTR menu and select normalcdf(. You'll need to enter values with the syntax normalcdf(lower value, upper value, mean, standard deviation).
I've assigned a few more problems from Section 1.3. I'll assign more problems after class tomorrow.
We will have the first homework quiz at the beginning of class on Thursday. The quiz will consist of several problems taken directly from homework assignments. For some problems, I will provide partial results for the problem and ask you to complete the rest. (For example, I might provide a graph that the problem requires and ask you to complete analysis or interpretation based on the graph.) For homework quizzes, you can bring and use any work you have done on homework problems. You will not be allowed to use any other resources (such as a calculator or the text). So, if you have done all of the assigned homework problems, you will be able to simply copy your work for the quiz.
I've assigned a few problems from Section 1.3. I'll assign more after we do more on density curves in the next class.
I've assigned a few additional problems from Section 1.1 that deal with a large data set. You'll probably want to use Minitab for these. You can get the data set in Minitab format in the folder \Jackson\Textbook Data\Ch01 on Alexandria. The name of the file you want is "ta01_009.mtp" which stands for "Table 1.9". The three letter extension ".mtp" stands for "Minitab Portable". If you are looking for ".mtp" files using the Open Worksheet menu item in Minitab, you will need to change the Files of type option from the default to Minitab Portable.
Problem 1.37 (d) asks you to make a back-to-back stemplot, females vs. males, for the GPA distribution in the data set. Minitab does not produce back-to-back stemplots but will produce separate stemplots based on a second variable. In the dialog box for Graph: Stem-and-Leaf..., enter gpa for Graph variables: and then enter gender for By variable:. You'll also need to uncheck the option Trim outliers.
I've assigned problems from Section 1.2. One of the problems involves the "1.5×IQR rule for potential outliers". I am leaving it to you to read and apply this idea. We can address any questions you have on this in class on Monday.
For class on Monday, we will meet in the Thompson 189 computer lab so you can get hands-on experience with Minitab.
I've assigned more problems from Section 1.1. Some of these will ask you to give qualitative descriptions of the shape of a distribution. I'm leaving it to you to read about most of this in Section 1.1. We can address questions you have in class tomorrow.
Read Section 1.1. Most of this is descriptive. We'll do some examples of constructing stemplots and histograms on Thursday. You should become familiar with the terminology introduced in this section. We will not go through all of this terminology systematically in class. We will use the terminology in class. Ask for clarification if we use words in class and you're not clear on the precise meaning.
Check out the Astronomy Picture of the Day.
You can look at exams from last time I taught Math 160. You can use these to get some idea of how I write exams. Don't assume I am going to write our exams by just making small changes to the old exams. You can use this old exam to prepare for our exam in whatever way you want. I will not provide solutions for the old exam problems.