Math 221A

Multivariate Calculus

Spring 2003

  • Course information
  • Daily notes
  • Homework assignments
  • Projects
  • Fun stuff
  • Gradebook
  • Daily notes

    Thursday, January 23

    You should work on the problems from Section 10.1 and bring any questions you have to class on Friday. You should also read the first part of Section 10.3 up to the subsection entitled "Definition of Dot Product" on page 688. The first part of Section 10.3 really belongs in Section 10.1.

    Friday, January 31

    You should work on the problems from Section 10.4 and turn in the appropriate problems on Monday. For Problem 60, look for an argument that does not involve using components explicitly. You should also think about how to give an argument for part (c) of Problem 43 that doesn't involve using components explicitly. In class, I suggested there may be a way to prove the "bac-cab" identity without using components, but after thinking about it I'm now not sure this can be done easily.

    Monday, February 3

    You should work on the problems from Section 10.5 and turn in the appropriate problems on Monday. We also need to have an exam soon, most likely the middle of next week. I'll announce a specific date in class on Wednesday.

    Thursday, February 6

    We've set the first exam for next Tuesday, February 11 from 7-9 pm (with alternates times for those who have other commitments). In class today, we began talking about vector-output functions. This material is in Section 11.1 of the text.

    Monday, February 10

    The first exam is tomorrow (Tuesday) from 7-9 pm (for most people) in our usual classroom (Th 318). The exam will cover material from Sections 10.1, 10.3, 10.4, 10.5, and 11.1 of the text. On Tuesday, I will not be available for my scheduled office hour. I will be available from 9:00-10:00 am, 12:00-1:00 pm, and 3:00-5:00 pm.

    Wednesday, February 19

    You can download an Excel spreadsheet file with the temperature data for the level curve homework from the handout from Section 12.1. Have Excel make a level curve plot and compare this to the one you made by hand.

    Monday, February 24

    We'll have the second exam next week, probably on Tuesday evening. We'll set a definite time in class on Wednesday.

    Monday, March 10

    Project 2 is officially due on Friday and I encourage you to finish it before you go off to Spring Break. However, I will give an extension until Monday, March 24 to anyone who asks.

    Wednesday, March 12

    The gradient of a function is a vector field. This would be a good time to try out the Vector Field Analyzer. This Java Applet allows you to plot and analyze a two-dimensional vector field. Be patient as the page loads; it takes a minute or two for the Java Applet code to set everything up. After the code is loaded, you will see a plot of the default vector field. You may want to change to some simple example such as the gradient of . This is the vector field
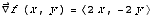
 . Enter the components of the vector field you want in the boxes near the bottom of the applet window. Note that the applet has three "layers" that you can change by clicking on the tabs labeled "Zoom lenses", "DEs/flows", and "Line int's." The "DEs/flows" tab is probably the one you want to start with. Click on the choice labeled "Integral curves" and then click somewhere in the plot region. A blue spot should appear. Clicking on the "Stop and Go" button will start the program drawing a curve that is tangent to the vector field. This is the path of steepest ascent if the vector field is a gradient vector field.

    Friday, March 14

    In class, we finished an argument for the second derivative test. Our text does not give any proof of or hint about why the second derivative test works so I've written a handout with the argument we talked through in class.

    Have a great spring break.

    Monday, March 31

    I've posted a homework assignment for Section 12.8 on constrained optimization using Lagrange multipliers. We discussed the idea of Lagrange multipliers in class before the exam but did not practice the use of this idea. We'll do a problem or two from this homework in class on Wednesday and Thursday. We'll also keep pushing on with material on integration for functions of more than one variable so you will also need to work on the assigned problems from Chapter 13.

    Tuesday, April 8

    Problem 48 in Section 13.3 says "the cone z=x2+y2." This should read "the paraboloid z=x2+y2."

    Wednesday, April 9

    The answer for Problem 43 in Section 13.3 given in the back of the text is incorrect. The correct result is 256p/3.

    We will skip over Section 13.4 for now and go straight to Section 13.5 on triple integrals. Problems are posted below.

    Our next exam will be in class on Friday, April 18 and will cover the material in Chapter 13.

    Monday, April 21

    This would be a good time to try out the Vector Field Analyzer. This Java Applet allows you to plot and analyze a two-dimensional vector field. Be patient as the page loads; it takes a minute or two for the Java Applet code to set everything up. After the code is loaded, you will see a plot of the default vector field. To plot a different vector field, enter the components of the vector field you want in the boxes near the bottom of the applet window.

    Friday, April 25

    The notation for line integrals used in the text is different than what I used in class today. Here's a handout that explains the relation between the two notations.

    Homework assignments

    Section Problems to do Submit Due date
    10.1 #1-45 odd #14,42 Monday, Jan 27
    10.3 #3-45 odd #34,50 Thursday, Jan 30
    10.4 #1-9 odd,17-35 odd, 39,43,59 #26,60 Monday, Feb 3
    10.5 #9,15,23,33,37,39,41,43,45,49,53,55 #50,54 Friday, Feb 7
    11.1 #1,9,13,19,23,31,33,37,45,53,55,57 None
    11.2 #5,7,9,11,13,15,21,23,25,29,31,35,44,53,57,60 #22,36 Monday, Feb 17
    12.1 #1,3,9,17,21,38-43 all,53,55,61,handout #20,52 Thursday, Feb 20
    10.2 #7,11,13-22 all, 41-47 all #12,48 Monday, Feb 24
    12.2 #3,11,15,19,31,33,37,39 #36,38 Wednesday, Feb 26
    12.3 #3-27 odd, 37,45,47,49 #8,42 Friday, Feb 28
    12.4 #1,3,7,9,17,23,25,29,31,33,37,43 None
    12.5 #13,15,21,23,27,37,43,47 #26,44 Monday, March 10
    12.6 #1,5,7,11,13,17,19,27,29,31,33,37,41,43,45,47,49 #40,50 Friday, March 14
    12.7 #5,11,13,21,25,29,35,37,43,45 #20,38 Wednesday, March 26
    12.8 #3,5,13,21,23,29 #24,38 Friday, April 4
    13.1 #1,5,13,15,19,23,25,31,41 #16,26 Friday, April 4
    13.2 #9,17,23,33,45,47,49,53,55 #26,48 Wednesday, April 9
    13.3 #3,11,13,25,31,33,35,37,43 #34,48 Thursday, April 10
    13.5 #5,7,11,15,17,19,35,45 #18,32 Monday, April 14
    13.7 #5,9,13,25,29,37,41,45a,49,51,53,55,57 None
    14.1 #5,9,11,15,23,29,45,47,54,55,59,62,63 #50,58 Friday, April 25
    14.2 #3,9,13,15,21,25,29,35,37 #16,42 Wednesday, April 30
    14.3 #5,7,11,15,17,27 #12,30 Friday, May 2
    14.4 #1,5,7,11,25,27,34 #10,26 Monday, May 5

    Return to top.

    Projects

    You will need a PDF viewer to read the files posted here. Visit the Adobe website to obtain a free reader (all major platforms are supported).

    Return to top.

    Fun Stuff

    You can go to http://math.la.asu.edu/~kawski/vfa2/ to play with the Vector Field Analyzer written by Matthias Kawski of the Mathematics Department at Arizona State University. This Java Applet allows you to plot and analyze a two-dimensional vector field. Be patient as the web loads; it takes a minute or two for the Java Applet code to set everything up. After the code is loaded, you will see a plot of the default vector field. You may want to change to some simple example such as F(x,y)=(x,y). Note that the applet has three "layers" that you can change by clicking on the tabs labeled "Zoom lenses", "DEs/flows", and "Line int's." The "DEs/flows" tab is probably the one you want to start with.

    Return to top.

    Gradebook

    To have your scores included in this web version of the gradebook, send me a code name to use.

    This version of the gradebook was lasted updated on May 19, 2003. The course score is computed with the total homework score weighted at 20%, the total project score weighted at 20%, and the total exam score weighted at 45% and the final exam weighted at 15%. The averages are computed using scores for all students in the class, not just those displayed here.

      HW                                         Projects   Exams         Totals       Course  
    Code 10.1 10.3 10.4 10.5 11.2 12.1 10.2 12.2 12.3 12.5 12.6 12.7 12.8 13.1 13.2 13.3 13.5 14.1 14.2 14.3 14.4 1 2 1 2 3 4 5 HW % P % E % FE Score Code
    0001 10 10 8 10 10 9 10 8 9 10 10 7 10 9 10   9 10 10 8 9 19 19 100 94 94 92 96 88.6 95 95.2 92 93.4 0001
    123ABC 10 10 9 10 10 8 10 9 10 10 10   10 9 9 6 4 7 9 10 8 17 15 87 78 71 86 73 84.8 80.0 79.0 81 80.7 123ABC
    Caduceus 10 9 5 10 10 9 10 10 10 7         9 7   5 6     15 15 83 81 84 87 66 55.7 75.0 80.2 89 75.6 Caduceus
    delta81 10 10 10 10 10 9 10   8 6 9   10 10 10   5   8 7   15 12 64 72 49 82 37 67.6 67.5 60.8 78 66.1 delta81
    Dodgers 9 10 9 10 9 10 10 10 10 8 10 7 10 9 10 8 8 10 10 9 9 19 19 78 87 87 85 76 92.9 95.0 82.6 89 88.1 Dodgers
    Dolphin 9 10 7 10 10 9 10 10 8 10 10 7 10 8 8 10   7 9 10 9 17 15 79 84 73 70 81 86.2 80.0 77.4 74 79.2 Dolphin
    green 9 8 6 10 10     9 8 8 9 7     5   9   10 8 9 15 14 83 87 82 87 88 59.5 72.5 85.4 81 77.0 green
    lola 10 10 10 10 10 7 9 10 9 10 8 7 10 10 10 9 9 10 8 10 8 15 12 91 52 58 92 84 92.4 67.5 75.4 60 74.9 lola
    NOMAD 10 10 6 10 10 8 10 9 10 8 10 8 7 9 7 8 10 10 8 10 5 14 15 66 71 79 92 42 87.1 72.5 70.0 82 75.7 NOMAD
    R22784 10 10 9 9 10 8 9 9 10 10 10 8 10 10 9 6 4 6 9 9 8 17 19 67 72 59 90 67 87.1 90.0 71.0 65 77.1 R22784
    reneacrain 10 10 10 10 10 10 10 10 10 8 8 7 9 10 9 9 9 8 10 8 9 19 19 99 81 77 84 86 92.4 95.0 85.4 86 88.8 reneacrain
    smt1 7 10 10 9 10 9 10 10 10 9 10 8 7 9 7 8 9 7 10 9 9 16 11 75 83 74 83 72 89.0 67.5 77.4 90 79.6 smt1
    TheFunkBomb 10 10 10 10 10   10 9 9 10 9 7 10 10 10 10 10     10 9 19 19 97 92 97 100 97 82.4 95.0 96.6 90 92.4 TheFunkBomb
    POSSIBLE 10 10 10 10 10 10 10 10 10 10 10 10 10 10 10 10 10 10 10 10 10 20 20 100 100 100 100 100 100.0 100.0 100.0 100 100.0 POSSIBLE
    AVERAGE 10 10 9 10 10 8.9 9.7 9.6 9.4 8.9 9.3 7.4 9.5 9.4 8.9 7.9 7.8 8.3 8.8 8.8 8.5 16.8 15.9 83 80 77 86 67 77.4 75.0 78.5 79.0 77.7 AVERAGE

    Return to top.