| Section | Problems to do | Target date | Quiz | Comments |
|---|---|---|---|---|
| 1.1 | #1.3, 1.13, 1.17, 1.18, 1.37, 1.38, 1.39 | Friday, September 7 | 1 | See daily note for information on data for last three problems. |
| 1.2 | #1.41, 1.43, 1.45, 1.47, 1.49, 1.58, 1.59, 1.71, 1.77 | Monday, September 10 | 1 | For 1.59, compute at least one mean and standard deviation "by hand". You can use a calculator to do the arithemtic. |
| 1.3 | #1.78, 1.80, 1.81, 1.82, 1.83 | Tuesday, September 11 | 1 | For 1.83, you'll need to read and understand the material on pages 68-69 of the text. |
| 1.3 | #1.87, 1.96, 1.97 | Thursday, September 13 | 2 | |
| 1.3 | #1.93, 1.99, 1.102 or 1.103, 1.104 or 1.105, 1.115 | Friday, September 14 | 2 | Where you have a choice, choose the problem that concerns the test you took (ACT or SAT). |
| 1.3 | #1.119, 1.120, 1.121, 1.124 | Monday, September 17 | 2 | |
| 2.1 | #2.1, 2.3, 2.9, 2.10, 2.13 | Tuesday, September 18 | 2 | For 2.13, see note below on Minitab. |
| 2.2 | #2.23, 2.31, 2.38, 2.39 | Thursday, September 20 | - | |
| 2.3 | #2.43, 2.45, 2.53, 2.58 | Friday, September 21 | - | |
| 2.4 | #2.63, 2.69, 2.71, 2.81, 2.82 | Monday, September 24 | - | |
| 2.5 | #2.85, 2.88, 2.93 | Tuesday, September 25 | - | |
| 3.1 | #3.3, 3.5, 3.6, 3.7 | Monday, October 1 | 3 | |
| 3.2 | #3.12, 3.13, 3.19 | Monday, October 1 | 3 | You can use Minitab to generate a list of random numbers. See note below. |
| 3.3 | #3.37, 3.41, 3.47, 3.48, 3.53, 3.55, 3.56, 3.57 | Tuesday, October 2 | 3 | |
| 3.4 | #3.66, 3.67, 3.69, 3.75 | Thursday, October 4 | 4 | For 3.75, you will do by hand what we saw going on in the applet during class. It's a bit tedious to do this by hand, but essential in order for you to understand what's going on. |
| 4.1 | #4.1, 4.3, 4.7 | Monday, October 8 | 4 | For 4.3, you can use the data we collected in class a few weeks ago. The data we collected is available in a Minitab file called M&MCounts.mtw in \\Alexandria\stats\Jackson\Data. For 4.7, you can use real dice if you have them around. |
| 4.2 | #4.11, 4.13, 4.15, 4.21, 4.25 | Monday, October 8 | 4 | |
| 4.2 | #4.14, 4.27, 4.30, 4.31 | Tuesday, October 9 | 4 | |
| 4.3 | #4.43, 4.45, 4.48 | Tuesday, October 9 | 4 | We did parts (a), (b), and (c) of Problem 4.48 in class last week as an example. |
| 4.3 | #4.53, 4.55, 4.56, 4.57 | Friday, October 12 | - | |
| 4.4 | #4.59, 4.61, 4.63, 4.65 | Monday, October 15 | - | |
| 4.4 | #4.67, 4.69, 4.70, 4.71, 4.73, 4.75, 4.79, 4.81 | Tuesday, October 16 | - | |
| 5.1 | #5.1, 5.3, 5.5, 5.13 | Thursday, October 25 | 5 | |
| 5.1 | #5.17, 5.19 | Friday, October 26 | 5 | See note below. |
| 5.1 | #5.20, 5.23 | Monday, October 29 | 5 | |
| 5.2 | #5.33, 5.37, 5.39, 5.41, 5.43 | Thursday, November 1 | - | |
| 6.1 | #6.1, 6.5, 6.7, 6.9, 6.13, 6.16, 6.25 | Friday, November 2 | - | Regarding Problem 6.13: 80 minutes per week? How about 80 minutes per day! |
| 6.2 | #6.35, 6.39, 6.41, 6.43, 6.49, 6.51, 6.54, 6.55, 6.57 | Monday, November 5 | - | |
| 6.3 | #6.73, 6.74, 6.77, 6.82, 6.83, 6.84 | Tuesday, November 6 | - | |
| 7.1 | #7.1, 7.10, 7.11, 7.13, 7.21, 7.25 | Monday, November 12 | 6 | For Problem 7.25, you do not need to do the optional part (d). |
| 7.1 | #7.29, 7.31, 7.37 | Tuesday, November 13 | 6 | For Problem 7.31, use the matched pairs idea described beginning on page 459 in the text. |
| 7.2 | #7.53, 7.73, 7.77, 7.81, 7.83 | Monday, November 19 | 7 | |
| 8.1 | #8.3, 8.5, 8.7, 8.11, 8.13 | Tuesday, November 20 | 7 | |
| 8.1 | #8.9, 8.29, 8.30 | Monday, November 26 | 7 | |
| 8.2 | #8.31, 8.33, 8.37, 8.43, 8.47 | Thursday, November 29 | - | |
| 8.2 | #8.44, 8.48, 8.51, 8.52, 8.53 | Friday, November 30 | - | |
| 9 | #9.1, 9.9, 9.19, 9.27, 9.33, 9.38, 9.39 | Monday, December 10 | 8 | For Problem 9.1, you'll need to read about the language of joint and marginal distributions in Section 9.1. |
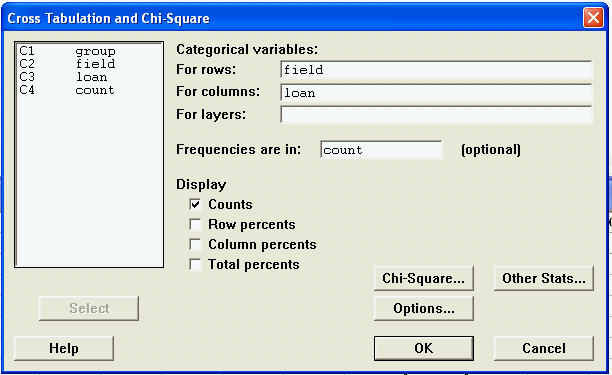
If you use the Minitab data files that are supplied with the text for the Chapter 9 problems, you'll want to use Stat: Tables: Cross-Tabulation and Chi-Square.... In the dialog box that opens, you'll need to identify the appropriate worksheet columns for
As an example, here's what the set-up should look like for Problem 9.38:
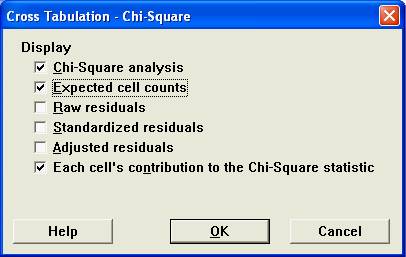
You'll also want to select a few options available using the Chi-Square... button. Here's a picture of the options you'll probably want:
We will begin class tomorrow with Quiz #8.
I've assigned problems from Chapter 9. You'll probably want to use Minitab (or something equivalent) for some of these problems. You can use Stat: Tables: Chi-Square Test (Table in Worksheet)...
If you've finished collecting data for your course project, you should begin analyzing it and thinking about your report. Sometime over the weekend, I'll post a handout with some guidelines for your report.
Chapter 9 does not have problems sets for each section. All of the problems are at the end of the chapter. I'll assign some of these after tomorrow's class
The next step in the course project is to submit a copy of your data by tomorrow. You can submit a photocopy of handwritten data or a digital copy of a Minitab (or Excel or similar) file as an e-mail attachment. If you have not finished collecting data, submit a brief report on your plans.
Exam #4 will be tomorrow (Tuesday, December 4) from 8:00 am to 9:20 am. The exam will test your understanding of material from Chapters 7 and 8. It will not cover material from any of the optional subsections, the "Beyond the Basics" sections, and Section 7.3. For the exam, you can bring
In preparing for the exam, you should
For more practice, you could look at exercises at the end of each chapter. Here's some that I think might be useful based on a quick read of the odd-numbered problems:
Exam #4 (the last one!) will be on Tuesday, December 4 from 8:00 am to 9:20 am. The exam will test your understanding of material from Chapters 7 and 8. It will not cover material from any of the optional subsections, the "Beyond the Basics" sections, and Section 7.3. For the exam, you can bring
In preparing for the exam, you should
For more practice, you could look at exercises at the end of each chapter. Here's some that I think might be useful based on a quick read of the odd-numbered problems:
In class today, we looked at the pooled estimate that can be used when doing a significance test for the null hypothesis that two population proportions are equal. Yesterday, we did an example of a significance test using separate (i.e., "unpooled") estimates. The text uses the pooled estimate for all of its examples and problems. You should use the pooled estimate if you want to compare your results with answers given in the back of the text.
In Minitab, you can do two-proportion inference using Stat: Basic Statistics: 2 Proportions.... The default setting uses the separate estimates. To use the pooled estimate for a significance test, go to Options... and check the box "Use pooled estimate of p for test" Note that this option will not change the confidence interval calculation since confidence intervals must be calculated using the unpooled estimate.
I've assigned additional problems from Section 8.2.
Yesterday, we talked through questions on a handout to review the "big picture". Here's my version of brief responses to each question.
In class today, we looked at a method for producing confidence intervals with large samples. For smaller samples, there is a plus-four method. This is similar to the plus-four method for a single proportion from Section 8.1. I'm leaving it up to you to read about the version in Section 8.2
We'll start class on Thursday with Quiz #7.
We did not discuss new ideas today so I have not assigned additional homework.
As we discovered in class, the answer in the back of the text for Problem 8.7 (a) is incorrect. The value given there is the standard error, not the margin of error. To get the margin of error, you must multiply by the appropriate critical z value.
I've assigned a few more problems from Section 8.1
In class, we looked at three options for getting a proportion confidence interval for a proportion:
I believe the 1-PropZInt function on a TI-83/84 computes a confidence interval based on a normal approximation for the sample proportion.
Part (b) of Problem 8.7 asks you to think about the issue of non-response in a survey. A large non-response can bias the results if the group that does respond does not represent the full group in ways that are relevant to what's being studied in the survey. If you do a survey and have a high non-response rate, you should do some analysis to understand potential bias. Some details on this kind of analysis are at the section Nonresponse Bias Analysis of the Statistical Standards for the National Center for Education Statistics.
In class, we looked at two examples using what our text calls the large sample confidence interval method. Tomorrow, we'll look at the plus four method. I've assigned a few problems from Section 8.1. For these, you can use the large sample method. I'll assign additional problems from Section 8.1 after class tomorrow.
I did not assign additional problems today. I will assign problems from Section 7.2 tomorrow after we have talked more about inference for the difference of two means.
I have not assigned additional problems today. Between now and class on Thursday, you should make sure you do and understand the assigned problems from Section 7.1. Part of this is being able to state conclusions in real-world terms. If you work on a problem and aren't sure if what you write is reasonable, you can send me an e-mail with your wording and I'll give you some feedback. For guidance, you can look at the wording of examples in the text. In particular, look at the wording in Examples 6.7, 6.8, 6.11, and 6.12 for how you might phrase conclusions of significance tests.
The next step in the project will be to do a pilot study. This will involve collecting a small amount of data in order to assess how well your data collection process works and to estimate how long it will take you to collect a full set of data. Based on this, you will write a brief progress report desribing how you pilot study went and any changes you think will be needed for the full study. This will be due next Tuesday. More details are on this handout.
I've assigned a few more problems from Section 7.1.
Course Project Warm-up #3 is due tomorrow. E-mail if you have questions or run into difficulties.
I've assigned some problems from Section 7.1.
If you have a TI-83/84 calculator, you can get cumulative probabilities for t-distributions. Go to the DISTR menu and select tcdf(. The required arguments for tcdf are a lower bound, an upper bound, and the degrees of freedom. For the example we did in class, we needed the cumulative probabilty between t=-1.4 and t=1.4 for df=4. The input tcdf(-1.4,1.4,4) returns a value of 0.766. The P-value for our example is thus 1-0.766=0.234.
You can also use Minitab to compute confidence intervals or P-values. You can do this for either the Z-statistic from Chapter 6 or the T-statistic we are now studying. I'll demonstrate this in class tomorrow. If you want to explore this on your own, go to Stat: Basic Statistics: 1-Sample Z... or Stat: Basic Statistics: 1-Sample t.... For each, you have a choice between Samples in columns or Summarized data. Use Samples in columns if you have data in a worksheet. Use Summarized data if you already know the sample mean and sample deviation. If you leave Test mean empty, Minitab will return a confidence interval but not a P-value. You can go to Options... to select the confidence level or select the type of alternative hypothesis.
Here's the handout with details on Course Project Warm-up #3.
Exam #3 will be on Thursday from 8:00-9:20. The exam will test your understanding of material from Chapters 5 and 6. It will not cover material from any of the optional subsections, the "Beyond the Basics" sections, and Section 6.4. This handout has a list of objectives for the exam. For the exam, you can bring
In preparing for the exam, you should
For more practice, you could look at exercises at the end of each chapter. Here's some that I think might be useful based on a quick read of the odd-numbered problems:
I will be available on Tuesday from 1:30 until about 5 pm with the exception of a few advising appointments. On Wednesday, I will be available most of the day except noon to 2 pm and a scattering of advising appointments. Call or email if you want to set up a specific time to meet.
Note that I added Problem 6.57 to the problems assigned for Section 6.2
Section 6.3 is descriptive. You are responsible for reading and understanding this material. I've assigned problems from Section 6.3.
Exam 3 will be on Thursday, November 8 from 8:00-9:20 am. It will cover material in Chapters 5 and 6, omitting Section 6.4.
In class, someone asked if the idea in Problem 5.54 of using statistical analysis to determine authorship is a joke. It's no joke. There's a field of study called stylometry devoted to use quantitative techniques for determing authorship. This article at Science News has some details and examples.
Note that I added Problem 6.25 to the problems assigned for Section 6.1. I have also assigned some problems for Section 6.2.
The focus of Chapter 6 is the ideas of statistical inference. The two types of statistical inference we will work with involve confidence intervals and significance tests. For now, we are constructing confidence intervals and doing significance tests using some unrealistic assumptions. The point of this is to simplify the computational details so we can focus on the meaning of our results. You should be able to
Exam #3 will be Thursday, November 8 from 8:00 am to 9:20 am. It will cover material from Chapters 5 and 6.
In thinking about confidence intervals, you might find it useful to distinguish between
Quiz #5 is on Thursday. It will include problems from assignments as indicated above. You can bring your notes and a calculator to use. I'll supply values for binomial distributions if needed.
Your preliminary project proposal is due on Friday. Here's some sources of ideas for project topics:
Exam #3 will be on Thursday, November 8 from 8:00-9:20 am.
I'll assign problems from Section 5.2 after tomorrow's class.
In class, I mentioned that you can get values for various probability distributions on a TI-83/84 calculator. Details are in the guidebook that comes with the calculator. If you don't have a guidebook, you can download one at the TI calculator site.
To get probabilities for a binomial distribution in Minitab, go to Calc: Probability Distributions: Binomial... At the top of the dialog box, select Probability. Then, enter a value for Number of trials (this is what we usually label n) and a value for Probability of success (this is what we usually lablel p). At the bottom of the dialog box, choose Input constant and then enter a value (this is what we usually label k). After you hit OK, Minitab will return information the Session window. To get probabilities for more than one value, set up a column of values in a Worksheet window. Then, go to Calc: Probability Distributions: Binomial... Do as above except choose Input column at the bottom and then specify the column you set up.
The answer for Problem 5.17(b) that is given in the Answer section of the text is based on using the normal approximation for a binomial distribution. We'll talk about this approximation in class tomorrow. For now, you should use an exact binomial distribution so your answer will differ from what's given in text.. You will probably find it convenient to use the Cumulative probability choice in Minitab's dialog box for Calc: Probability Distributions: Binomial...
We have Fall Break next week so we won't meet again until Thursday, October 25. We will not have a quiz next week. Our next quiz will be Thursday, November 1.
I've assigned a few problems from Section 5.1. We'll pick up with more of the ideas from Section 5.1 after break.
Enjoy your break!
Exam #2 will be on Thursday from 8:00-9:20. The exam will test your understanding of material from Chapters 3 and 4. It will not cover material from any of the "Beyond the Basics" and Section 4.5. This handout has a list of objectives for the exam. For the exam, you can bring
In preparing for the exam, you should
Exam #2 is on Thursday, October 18 from 8:00-9:20 am. The exam will cover material from Chapters 3 and 4. It will not cover material from any of the "Beyond the Basics" and Section 4.5.
I've assigned a few more problems from Section 4.3. The new problems deal with continuous random variables.
In the example we started at the end of class, I was trying to show a connection between something familiar (computing the mean of a distribution for a variable) and something new (computing the mean of a random variable). To compute the mean of a distribution of values for a variable, we add up all of the values in the distribution and then divide by the number of values. We can rearrange the arithmetic in this calculation so that we calculate the same number in a new way. The new way is to multiply each possible outcome by the proportion of values with that outcome and then add those results. This is a weighted sum of the outcomes. I'll try to clarify all of this tomorrow.
We will have Quiz #4 at the beginning of class on Thursday. It will consist of problems taken from homework assignments as indicated in the list above. You can use any notes you bring. You might also want a calculator.
I have not assigned any new problems today.
I've assigned more problems from Section 4.2 and a few problems from Section 4.3. There will be more from Section 4.3 after tomorrow's class.
We started our look at random phenomena and probability. I've assigned problems from Sections 4.1 and 4.2. I'll assign a few more problems from Section 4.2 after Monday's class.
I'll wait until tomorrow to assign new problems so you can focus on finishing Course Project Warm-up #1. In the meantime, you should read Section 4.1
Here's the Oxford English Dictionary on die as a noun:
For the Course Project Warm-up, you will need to compute BMI from height an weight data. If you use the Caclculator feature in Minitab, you will need to understand the syntax for multiplication and powers. For multiplication, use *. For example, if you want to multiply 5 times a variable called MyVariable, use 5*MyVariable. For powers, use **. For example, to square MyVariable, use MyVariable**2.
To generate a list of random integers in Minitab, use Calc: Random Data: Integer.... This will bring up a dialog box in which you can enter the number of rows of data, a storage column, a minimum value, and a maximum value.
Here is the assignment handout for Course Project Warm-up #1. Come talk with me or send e-mail if you have questions or difficulties on the assignment.
Much of the material in Chapter 3 on Producing Data is descriptive. We'll outline main ideas in class and then you will have responsibility for reading details in the text. We'll clarify the details as we discuss questions from reading and assigned homework.
Exam #1 will be on Thursday from 8:00-9:20. The exam will test your understanding of material from Chapters 1 and 2. For this exam, a well-prepared student should should be able to
To separate data by a categorical variable in Minitab, use Data: Unstack Columns....
I've looked for more details on the meaning of the distance variable in the data in Table 2.7 for Exercise 2.82. The endnote references a multimedia statistics "textbook" called ActivStats. This product includes the software described in the problem. I could not find specific details about the distance variable so I'm still a little confused.
If you want to play with a set-up similar to the one described in Exercise 2.82, try this applet. The distance measured in this experiment is the distance between the center (or centre) of the current target and the click location. This distance measures how the accuracy of the click. This differs from how we came to interpret the meaning of distance in the Table 2.7 data.
Exam #1 will be on Thursday from 8:00-9:20 am. The exam will test your understanding of material from Chapters 1 and 2.
You should read Section 2.4 and work on the assigned exercises. We'll clarify the ideas in Section 2.4 in class on Monday by discussing questions you bring from the reading and homework.
One idea introducing in Section 2.4 is a residual plot. Exercise 2.63 calls for you to make a residual plot. You should do this by hand to make sure you understand what a residual plot is all about. After that, you can use computing technology to make other residual plots. In Minitab, go to Stat: Regression: Filled Line Plot.... Fill in the Response and Predictor (i.e., explanatory) variables as usual. Then click the Graphs... button. In the box Residuals versus the variables:, enter the Predictor (explanatory) variable. Hit OK and then OK again on the main dialog box. Minitab should produce two plots: the scatterplot of response variable vs. explanatory variable with the regression line included and the scatterplot of residuals vs. explanatory variable.
In class, we talked about the least-squares regression line for two variables that have some linear association. Our focus was on understanding how to compute and think about the slope and intercept of a least-squares regression line. Tomorrow, we will talk about the idea behind the line. This will explain the least-squares part of least-squares regression line.
To get a plot and formula for a least-square regression line in Minitab, use Stats:Regression:Fitted Line Plot....
To get the correlation for two variables in Minitab, use Stat: Basic Statistics: Correlation....
Quiz #2 will be at the beginning of class (8:30) on Thursday. It will consist of problems taken from homework assignments denoted above. You can use any notes you bring. You should bring a (working!) calculator. I'll supply a table of standard normal probabilities similar to Table A from the inside front cover.
In class, we speculated on what actually went on in the study summarized in Exercise 2.9 on "social distress" and branin activity. Here's a fuller description from the original source:
fMRI scans were acquired while participants played a virtual ball-tossing game ("CyberBall") with what they believed to be two other players, also in fMRI scanners, during which the players eventually excluded the participant (21). In reality, there were no other players; participants were playing with a preset computer program and were given a cover story to ensure that they believed the other players were real (22).
In the first scan (ISE), the participant watched the other "players" play Cyber-Ball. Participants were told that, because of technical difficulties, the link to the other two scanners could not yet be made and thus, at first, they would be able to watch but not play with the other two players. This cover story was intended to allow participants to view a scene visually identical to ESE without participants believing they were being excluded. In the second scan (inclusion), participants played with the other two players. In the final scan (ESE), participants received seven throws and were then excluded when the two players stopped throwing participants the ball for the remainder of the scan (~45 throws). Afterward, participants filled out questionnaires assessing how excluded they felt and their level of social distress during the ESE scan (22).
It doesn't sound as traumatic as we were perhaps imagining. You can access an electronic version of the full original source through our library's full-text databases. The reference is "Does rejection hurt? An fMRI study of social exclusion" Naomi I Eisenberger, Matthew D Lieberman, Kipling D Williams. Science. Washington: Oct 10, 2003. Vol. 302, Iss. 5643; p. 290. A fast way to get started is through the Journal Locator link on the library main page. A search for the journal Science will bring up several options. I used the ProQuest Research Library database.
For Exercise 2.13, you are asked to make a scatterplot that distinguishes points for male and female individuals. To do this in Minitab, you'll need a data file with a column for sex in addition to the columns for mass and rate. In Minitab, go to Graph: Scatterplot.... In the first dialog box, change to With Groups from the default of Simple. In the following dialog box, set up Y variables and X variables as usual. Then, enter sex in the box labeled Categorical variables for grouping (0-3):.
A Probability Plot in Minitab serves the same purpose as a normal quantile plot as described in the text. The default format for probability plots in Minitab differs from what the text uses in three ways:
You can use the Minitab default. The central question remains the same: To what degree do the points fall along a straight line? The more the points fall along the line, the more closer the distribution is to being normal. With the Minitab default, granularity will show up as points lined up vertically. With the text's choices, granularity will show up as points lined up horizontally. You don't need to worry about the precise meaning of the 95% confidence interval curves. You can use these in making a judgment about normality. If most of the points fall within the curves, assuming normality is probably fine.
Here's steps you can take to have Minitab produce a plot in the same style as the text:
If you want to get rid of the confidence interval curves, go to Distribution... on the main dialog box (next to the Scale... button you used above). Go to the Data Display tab and uncheck Show confidence intervals.
Minitab tip: In class a few days ago, we looked at the variable Height from the Fall 2007 Math 160 Survey. To separate data for females and males, I manually copied and pasted. You can automate this using \Data\Unstack Columns....
On Thursday, we will start the hour with Quiz #1. The quiz will consist of several problems taken from the homework assignments for Sections 1.1 and 1.2, and the first assignment for Section 1.3. You'll have ten minutes for the quiz. You can use a calculator to do arithmetic.
In class, we looked at one variable from the Fall 2007 Math 160 survey. All of the data from the survey is available on Alexandria in file \stats\Jackson\Data\Survey\M160F07Rev.MTW
I don't have a specific office hour scheduled for Wednesdays but I am generally available most of the day except between noon and 2 pm. Stop by, call, or e-mail if you have questions or want to talk.
Here's a brief reminder on how to get to Minitab versions of the text's data from examples, exercises, and tables:
Tomorrow, Friday September 7, we will meet in the McIntyre 324 computer lab so you can get some experience using Minitab. I also plan to spend some time addressing questions from homework.
I think I have fixed the problem that prevented you from opening the link to the Minitab version of the data from Table 1.9 in the previous Daily Note. Try it again. Let me know if it doesn't work.
I've assigned a few problems from Section 1.2. I'll assign more problems from this section tomorrow after we've talked about standard deviation and you've gotten some experience with Minitab.
Read Section 1.1. Most of this is descriptive. You should become familiar with the terminology introduced in this section. We will not go through all of this terminology systematically in class. We will use the terminology in class. Ask for clarification if we use words in class and you're not clear on the precise meaning.
Try your hand at the assigned problems. The last three problems involve a larger data set so you'll probably want to use computing technology, such as Minitab, for these. Minitab should be available in the Library Commons, Library 034, McIntyre 324, and Thompson 177/189.
Rather than entering all of the data for the last three problems into Minitab by hand, you can download a data file:Try to get started on Minitab, but don't worry if you don't get too far. We'll talk more about using Minitab in class on Thursday. I'll show you how to download data for any of the text's examples and exercises. (If you want to explore downloaded data on your own, follow the textbook link below.)
Check out the Astronomy Picture of the Day.